Emotions as the Secret Architects of Cinema
An analysis of emotions and their effects in movies.
Joy
Surprise
Sadness
Anger
Fear
Disgust
Joy
Surprise
Sadness
Anger
Fear
Disgust
Made by Team PHPJJ1
The curtain opens...
What makes a movie stay with you long after the credits roll? Is it the plot twists, the unforgettable characters—or something deeper, something more visceral? At the heart of every great movie is how it makes you feel. Joy, sadness, fear, anger, surprise, disgust—these are not only fundamental emotions to human nature, but they shape the stories we tell and how we experience them.
In this datastory, we pull back the curtain to reveal how emotion drives the magic of movies. How have emotional tones in movies changed over time and across genres? Can a movie's emotions predict its cast? What role does language play? And most importantly, what emotions do audiences really want to see?
The Heart of Our Story: The Data Behind the Emotions
Before we begin our journey, we need a foundation to build on. Therefore, we will use the CMU Movie Summary Corpus [1]. Let's look under the hood.
| Dataset | Count | Description |
|---|---|---|
| Movie Metadata | 81,741 movies | Details such as name, languages, and genre |
| Character Metadata | 450,669 characters | Information such as age, name, and gender mapped to their respective movies |
| Plot Summaries | 42,306 movies | Extracted from Wikipedia |
Emotions can be complex and difficult to define, so we will focus on Ekman's Six Core Emotions: joy, sadness, anger, fear, surprise, and disgust, along with a neutral emotion for balance. To identify these emotions in our movie data, we performed natural language processing with the pre-trained model j-hartmann/emotion-english-distilroberta-base [2]. The model outputs a probability distribution over the emotions, where the probabilities sum to one. Each emotion is assigned a value between 0 and 1, representing the intensity of that particular emotion in the movie plot summary.
Emotional Profiles
Let's start with an example to see how this model works. We will look at the emotional profile of 3 classic movies—real blockbusters for their time: Titanic, Die Hard and Saw. The model outputs its prediction given the entire Wikipedia plot summary for each movie.
We can see that each movie has a unique emotional profile. Titanic is a mix of joy and sadness, Die Hard peaks hardest in anger and Saw features disgust. The appearance of a neutral emotion might seem weird but makes sense if you consider that the emotional profiles are being extracted from plot summaries.
Then neutral represents the case where a movie is just summarizing plot information and does not effectuate a real emotion of any kind. We can treat it like a comparison baseline for all the other emotions.
Now let's zoom out and see how the emotions are distributed across all movies.
We can see that the emotions are not evenly distributed in our data: neutral, anger, and disgust are more dominant, while surprise and joy are less common. This uneven distribution could also be explained by an imbalance in the genres and the emotions used in them. Nevertheless, all emotions are significantly represented, so lets start our journey into the emotional landscapes of cinema.
What are the predominant emotional tones used in films and how do they vary across different movie genres?
Our data contains hundreds of very fine-grained genres, making it difficult to perform a meaningful analysis. Therefore, we decided to use only genres with 2000 corresponding films. Different genres are seem intuitively associated with different emotions: Horror movies are disgusting and comedy movies spark joy. But is this really the case? Let's have a look.

We can see that certain genres have overall stronger emotions than others. Some values are expected, such as the high value of fear in horror or the high value of anger in action but others are surprising. For example the relatively high value of anger in family films. The imbalance between emotions we saw earlier is displayed as well where surprise and joy have very low values across all genres. This is surprising, especially in genres like Family Film or Comedy but also shows that these emotions seem not to be as strong as for example anger which has high values across all genres.
Emotions and Statistics: Building the Framework of Film Genres
If emotions are the architects of cinema, statistics is the ruler ensuring precision and balance in their construction. To determine the emotional blueprint of each genre, we calculated the average emotional tone across genres and added the average emotion score as a vertical line for better comparison.
So we can see in more detail which role the emotions play across the genres. But as we have seen before, we have an imbalance in our emotions across all movies. We employed t-tests to isolate emotions significantly above the global genre average. This approach revealed the standout emotions across our genres.

We can see that depending on the genre, different emotions are significantly above average. This emphasizes once more that the impact and role of emotions in a movie highly depends on the genre of that movie.
While the relationship between genres and emotions may seem intuitive, emotions aren't static—they ebb and flow with time. Cinema acts as a mirror to society, reflecting the emotional state of different eras. Let's explore how these emotional patterns have evolved over the decades.
How has the emotional tone of films evolved over time within each genre?
Emotions across time and space
To explore how these emotions have evolved, we conducted time series analyses for each prominent emotion within the selected genres. Patterns emerged, showing the rise and fall of emotional tones across time. For instance, fear in horror films has steadily increased, while disgust has experienced a steady decline since its peak in the 1970s.
Back to the Future: Time Series of Emotions
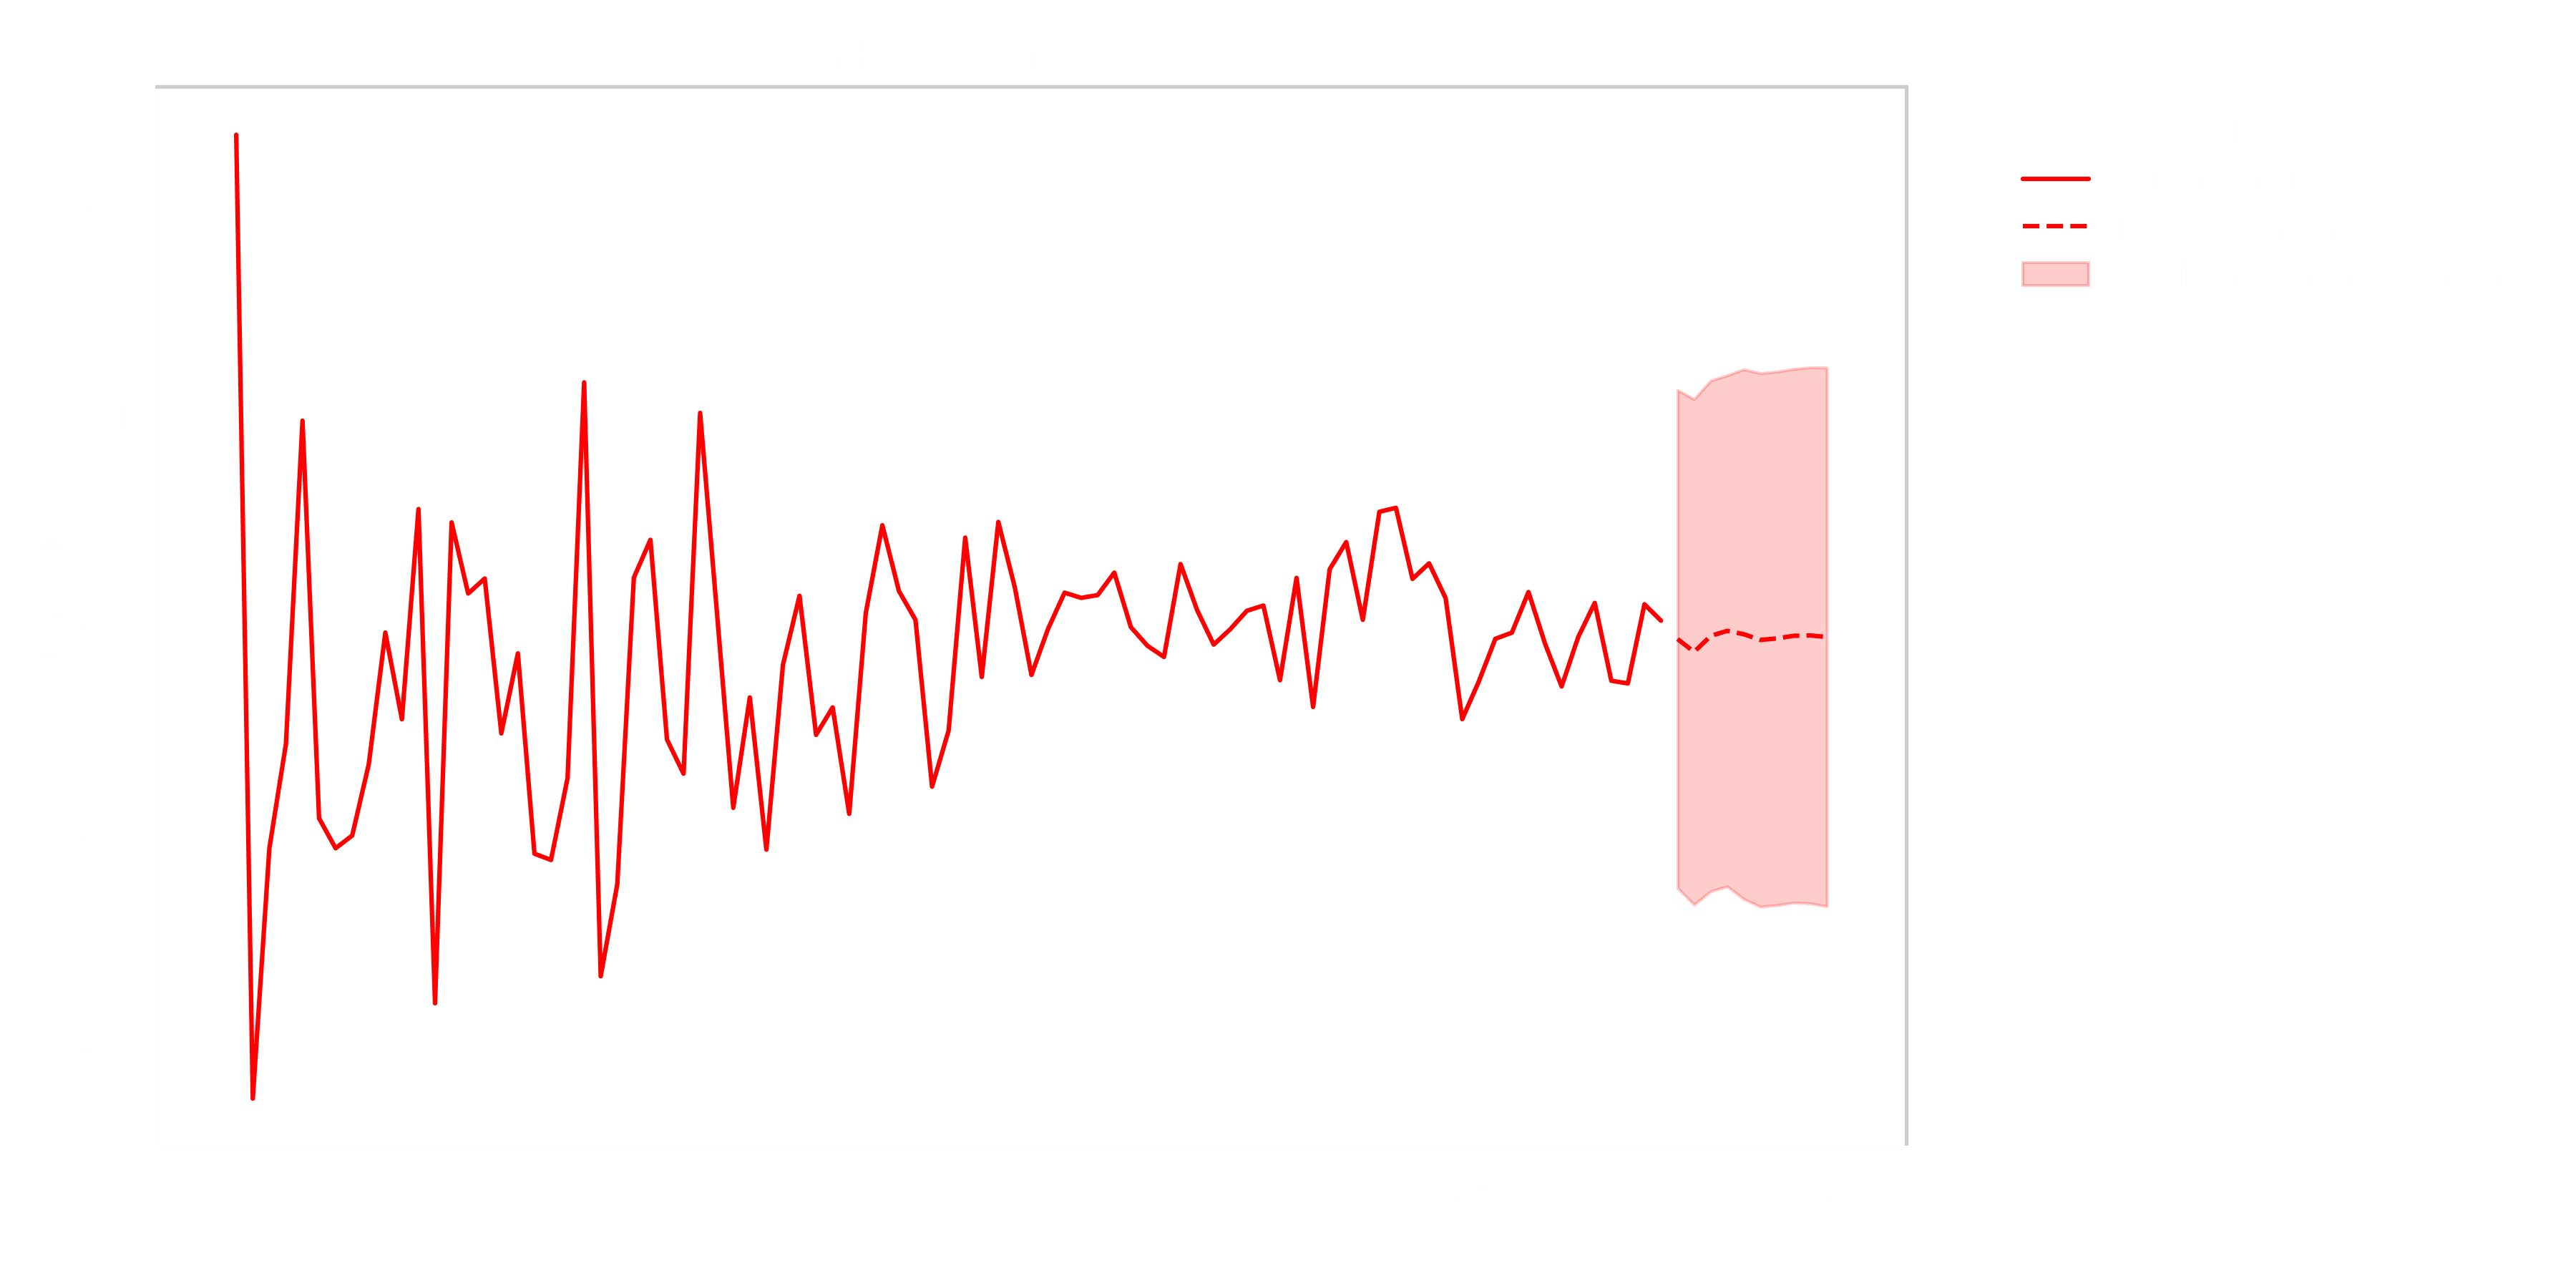
Finally, we applied ARIMA models to forecast emotional trends over the next ten years. These projections offer insights into the future trajectory of storytelling: will action movies become darker? Will dramas continue to balance sadness with hope? Only time will tell, but our models provide a glimpse into cinema's emotional future.
ARIMA (Autoregressive Integrated Moving Average) models help us predict future values by looking at patterns in historical data. They work by
- Looking at how past values influence current values
- Accounting for overall trends by removing them
- Learning from past prediction mistakes to make better future predictions
Think of it like predicting tomorrow's weather - you look at recent weather patterns, account for the season, and adjust based on how accurate your previous forecasts were.
has 3 components:
-
AutoRegressive (AR):
Relates the current value of the series to its past values.
Formula:Where:
- (): Value at time (t)
- (): AR coefficients
- (): White noise (random error)
-
Integrated (I):
Represents the number of differencing operations needed to make the time series stationary.Differencing Formula:
-
Moving Average (MA):
Models the dependency between an observation and residual errors from a moving average model applied to lagged observations.
Formula:Where:
- (): MA coefficients
The Forecast Is Cloudy with a Chance of Jumpscares
For each emotion, we found the genres for which it was statistically significant. We then used the ARIMA model to forecast the emotional tone for those genres over the next 10 years.
Use the interactive charts below to explore the ARIMA's predictions per emotion.
While our forecasts paint a picture of future emotional trends in cinema, let's bring it back to the present. How do emotional tones shape the fundamental characteristics of movies? We explore how emotions act as hidden architects, influencing key aspects of film production.
How does the emotional tone of films influence the selection of actor traits, such as age and gender?
To find an answer to this question we will use the all-time classic of statistics. Linear Regression with Ordinary Least Squares. We want to explore how different emotions influence attributes of the cast of a movie.
What is the average age of the involved actors? Is there a difference in the proportion of male and female actors across the emotions? To obtain a meaningful analysis we have to be careful! The emotion scores add up to one so there is severe multicoliniarity. Therefore we will drop the neutral emotion because it is the least interesting one for this analysis. Therefore our regression results present the impact of an increase of the emotional tones relative to the neutral emotion, which is exactly what we are searching for.
First let's look at the average age across the movies.
Interesting, all coefficient are negative! We have to be careful by interpreting these results because we have to be sure that they are significant. Thankfully this is included in our regression analysis.
| Emotion | Coefficient | Std. Error | P-Value | Impact Direction |
|---|---|---|---|---|
| Disgust | -1.2892 | 0.244 | <0.001 | Negative |
| Fear | -0.0451 | 0.224 | 0.841 | Neutral |
| Anger | -0.8065 | 0.226 | <0.001 | Negative |
| Sadness | -1.5702 | 0.228 | <0.001 | Negative |
| Surprise | -0.7737 | 0.377 | 0.040 | Negative |
| Joy | -2.1611 | 0.395 | <0.001 | Negative |
All coefficients except fear are significant predictors! So we can see that in general, movies with more emotion include younger actors. This is especially significant for movies where sadness, joy and disgust are dominant. This makes sense, as in movies where joy and sadness are dominant emotions often kids are involved which decreases the average age of the cast.
Movies with high disgust scores often might involve protagonists that are teenagers or young adults. Seeing grandpa in a horror movie might be a bit odd.
But these results could also be confounded by another variable: the proportion of female and male actors in movies. Are there just more female actors in joyful movies which then tend to be younger? Our analysis covers this as well. We encoded male actors with zero and female actors with one to calculate the average gender for a movie. So higher values represent a higher proportion of female actors while lower values represent a higher proportion of male actors.
Almost all emotions except anger seem to increase the proportion of female actors! Again we first have to check the significance of our predictors before jumping to conclusions:
| Emotion | Coefficient | Std. Error | P-Value | Impact Direction |
|---|---|---|---|---|
| Disgust | 0.0460 | 0.008 | <0.001 | Positive |
| Fear | 0.0306 | 0.007 | <0.001 | Positive |
| Anger | -0.0293 | 0.007 | <0.001 | Negative |
| Sadness | 0.1069 | 0.007 | <0.001 | Positive |
| Surprise | 0.0828 | 0.012 | <0.001 | Positive |
| Joy | 0.1244 | 0.013 | <0.001 | Positive |
Perfect all emotions are significant predictors! We can see that stronger emotions tend to increase the proportion of female actors in movies. This trend is the strongest for joy and sadness which corresponds with our age analysis: Joy and sadness increase the proportion of female actors in movies and decrease the average age, indicating that female actors tend to be younger than male actors.
The exception is anger 😡. Movies with high anger scores show a decreased proportion of female actors. This could reflect either casting biases in action/conflict-heavy films, or that male-dominated movies tend to feature more anger-driven narratives. Either way, it raises questions about gender representation in emotionally intense films.
We have seen that stronger emotions in general tend to decrease the average age of actors and increase the proportion of female actors indicating that a balanced, younger cast can create stronger emotions. The outlier in the anger emotion shows that there are maybe still some clichés to overcome or that male dominant movies just overall tend to have more anger in them. After having a detailed look at the actor level we will go one level above and look at the languages in our data. Let's jump into the final act of our regression play.
Does the emotional tone of films differ between movies in different languages?
To explore this question we will first have a look at the top 15 languages in our data.
What a variety of languages in our data! Even though we only looked at the top 15 we can see there are a lot more languages, summed up in Other. We also can see that English is by far the most used language.
We want to see how emotions vary across languages, so how different languages and associated with them cultures, influence the emotional tone in movies. Again the star of our play is an OLS regression analysis. We need again a variable to compare against. Because English is kind of the normative in the movie industry and by far the most used language in our movies we will used it for comparison. Therefore we analyze how languages that have an significant impact on the emotional tone of a movie influence it compared to English language:

Language alone explains little of a movie's emotional tone, as shown by the extremely low -values. However, some clear patterns emerge. For fear, joy, neutral and sadness, all significant languages show consistent effects compared to English. Non-English films tend to have less fear but more sadness, suggesting English-language movies are generally more frightening but less sad. Some languages show particularly strong differences—Urdu films are notably sadder than English ones, while Telugu films contain more anger.
However ultimately, movies are made for people, they move us, inspire us and contribute to discussions in society. Thats why emotions are so important in movies—they are supposed to make us cry, frighten us or make us laugh. So we want to see which emotions does the audience want to see? Are there certain patterns or combinations of different emotions that influence the critics of a movie?
For this thriller we first need some additional data. We use the MovieLens dataset [3] to obtain 32 million ratings for 87.585 movies by 200.948 users. We merge this data with our existing data based on title and year to set the stage for our last dance:
Can films be clustered based on their emotional tone, and do these clusters reveal distinct patterns in consumer ratings?
We discovered that each emotion is tagged with a unique “emotional signature": a combination of our seven basic emotions, like ingredients of a secret cinematic recipe. On top of this, we have consumer ratings, that almighty number that can make or break a film’s reputation.
We notice that emotions run the scale. Some films lean heavily into one emotion and some others rely one multiple emotions. Ratings, of course, vary widely with a mean of 3.05 and a standard deviation of 0.8. Could there be a pattern linking the emotional tone of a film to how much people love or hate it?

The Classic Clustering Approach
We begin with a time-honored technique**: k-means clustering**. Using a straightforward distance metric (cosine similarity to align to our data) to group films by their emotional tone, we find that the algorithm sorts them into neat clusters, where the optimal number of clusters matches the number of emotions and therefore, each is dominated by single emotions. One cluster might be primarily "joy" films, another "fear," another "anger," and so on.

At first glance, this seems like the ideal setup. We can identify which single-emotion groups correlate to higher or lower ratings. Maybe films bursting with joy and a sprinkle of surprise consistently score higher? Maybe fear-driven horror flicks fare poorly? But unfortunately, the average ratings of each cluster don't deviate noticeably from the global mean of movie ratings. This is not that surprising considering how generalized the clusters are (only 7 clusters) and each cluster averages over a large number of movies.
A More Nuanced Lens: DBSCAN and the Shape of Emotional Space
We know that our emotional data has a special structure: all emotion values sum to one, placing every movie’s emotional signature on a simplex—think of it like points scattered across the surface of a triangular landscape. Classic clustering methods struggle to follow the subtle curves and folds of this shape.
Enter DBSCAN, a clustering algorithm that excels at finding irregularly shaped groups without forcing them into spherical molds. DBSCAN scans through our emotional galaxy and discovers clusters of movies that share not just one dominant emotion, but combination of emotions like a dash of surprise mixed with a hint of sadness. These clusters are more fine-grained and carry secrets that the straightforward k-means approach missed. Now we can pinpoint clusters that differ significantly from the global average rating.
Revealing Patterns: Winners and Losers in the Emotional Landscape
Let’s highlight two extreme examples that DBSCAN consistently uncovered:
The Horror Cluster of Despair:
Across multiple DBSCAN configurations, clusters dominated by “fear” with a side of “sadness” and a pinch of “surprise” emerged as low-performing clusters. These poor horror movies—masterpieces received way lower ratings on average (about one standard deviation below the average). It’s as if the audience said: We appreciate the adrenaline, but this grim emotional cocktail leaves a sour aftertaste or more likely it is one of the well known trash horrormovies that lack of profile (e.g. too less surprise, too predictable).

The Uplifting Surprise-Sadness Fusion:
On the brighter side, we discovered clusters defined not by a single emotion, but by unusual yet harmonious blends like “surprise” coupled with “sadness,” or films where “neutral” and “joy” swirl together. Odd as it sounds, viewers seemed to reward complexity and contrast. Films that evoked not just one emotion, but two seemingly disparate feelings, often scored well above average. Perhaps there’s something about these nuanced emotional journeys that resonates with audiences, leaving them more satisfied, more engaged, like in the case of the combination “surprise” and “sadness” leaving the audience with their own thoughts after an emotional historical war movie.

Intriguingly, we also uncovered another winning recipe: high disgust intertwined with a bit of anger, a dash of neutral, and a hint of sadness—but crucially, without fear. This unconventional mix managed to score impressively high, perhaps because it offers emotional complexity without relying on the all-too-familiar jump-scare formula.

A Glimmer of Hope for Horror
It isn’t all doom and gloom for the fearful movies. Another intriguing pattern popped up: clusters that combined “fear” and “anger” in similar measure scored either very poorly or surprisingly well. This duality suggests that while some viewers run screaming from such films (both literally and figuratively), others—perhaps genre enthusiasts or thrill-seekers—reward the courage it takes to dive into the darkest emotional corners.
In other words, it’s not just the emotion itself, but how it’s paired. A delicate balancing act of "fear" and "anger" might repel a casual viewer but enthrall a niche audience, resulting in polarized ratings. The takeaway? For horror producers, it pays to know your audience and craft the emotional experience just right.

Conclusion on emotional clustering
Can films be clustered based on their emotional tone, and do these clusters reveal distinct patterns in consumer ratings? The answer is both yes and no. While our initial k-means approach indicated that no single emotion stood out as consistently leading to higher or lower ratings, more nuanced clusters discovered using DBSCAN offered deeper insights. These finer-grained clusters showed that certain specific combinations of emotions—though represented by only a small portion of the entire dataset—can indeed correlate with significantly higher or lower ratings than the average. However, these findings should be interpreted with caution since the number of movies in each such cluster is limited, and the results are sensitive to the clustering configuration used. In other words, we’ve uncovered intriguing patterns, but the subtlety and sparsity of the data remind us to treat these conclusions carefully.
In the end...
Our deep dive into cinema's emotional landscape has revealed interesting patterns in how movies make us feel. While some findings confirmed our intuitions—like fear dominating horror films—others surprised us, such as the unexpected presence of anger across multiple genres.
Most importantly, we discovered that successful films often blend seemingly contradictory emotions, creating complex experiences that resonate with audiences. As cinema continues to evolve, these insights suggest that the most impactful stories won't be those that simply maximize a single emotion, but those that carefully orchestrate emotional combinations to create unique and memorable experiences.
References
[1] D. Bamman, B. O’Connor, and N. A. Smith, “Learning Latent Personas of Film Characters,” Aug. 2013.
[2] Jochen Hartmann, "Emotion English DistilRoBERTa-base", https://huggingface.co/j-hartmann/emotion-english-distilroberta-base/, 2022
[3] GroupLens Research, “MovieLens 32M,” GroupLens, May 17, 2024. Available: https://grouplens.org/datasets/movielens/32m/